Debugging a Linux Driver with ZeBu
Introduction
This article describes the successful bring-up in emulation of Linux on an embedded processor core. During the Linux boot process, one issue was found with the serial port. The problem was debugged using the combined software and hardware views available with the ZeBu emulator.
Setup
The SOC consists of a Tensilica Diamond 232L processor core, a memory subsystem with RAM and Flash memory and a UART controller. This represents the minimal configuration required to boot Linux. On the software side, we use the Linux distribution from Monta Vista, which is based on a 2.6 kernel. We use an initramfs file system to provide Linux with the basic structure it needs at boot time and we use BusyBox to provide the main Linux commands and a shell in a memory-efficient manner.
The entire SOC is emulated on a ZeBu-UF 0.5 and interacts with the outside world through two transactors. A UART transactor displays the console of the emulated SOC in a window on the host workstation. A JTAG transactor connects to the Tensilica software tool chain (Xplorer or xt-gdb for software debugging). Using transactors for all interfaces guarantees that the emulation is completely accurate and in-sync with a real-world scenario, even if hardware breakpoints and single-stepping clocks are used for hardware debugging. A key benefit of using transactors is that each emulation run can be reproduced identically, making it much easier to isolate and reproduce bugs. This can be a major time-saver when chasing a bug that tends to move when you try to isolate it.
The Problem
Once we load the Linux image in the emulated processor, Linux starts to boot, as we can see on the console. However, around the time where the init process is supposed to start a shell, we get an error message and there is no further output on the console:
ZeBu-Diamond Console
Linux version 2.6.10_mvl401-xt2000-xtensa_linux_le (alain@treasure5.us.eve) (gcc version 3.4.3 (MontaVista 3.4.3-25.0.135.0702842 2007-03-23)) #76 Tue May 1 11:02:33 PDT 2007
  On node 0 totalpages: 8192
  DMA zone: 8192 pages, LIFO batch:2
  Normal zone: 0 pages, LIFO batch:1
  HighMem zone: 0 pages, LIFO batch:1
Built 1 zonelists
Kernel command line: console=ttyS0 mem=64M debug init=/sbin/init root=/dummy
PID hash table entries: 256 (order: 8, 4096 bytes)
Console: colour dummy device 80x25
Dentry cache hash table entries: 8192 (order: 3, 32768 bytes)
Inode-cache hash table entries: 4096 (order: 2, 16384 bytes)
Memory: 30936k/32768k available (606k kernel code, 1784k reserved, 80k data, 528k init 0k highmem)
Calibrating delay loop... 15.76 BogoMIPS (lpj=78848)
Mount-cache hash table entries: 512 (order: 0, 4096 bytes)
spawn_desched_task(00000000)
desched cpu_callback 3/00000000
ksoftirqd started up.
desched cpu_callback 2/00000000
desched thread 0 started up.
Linux NoNET1.0 for Linux 2.6
Initializing Cryptographic API
Serial: 8250/16550 driver $Revision: 1.90 $ 6 ports, IRQ sharing disabled
Registering platform device 'serial8250'. Parent at platform
ttyS0 at MMIO 0x0 (irq = 4) is a ST16650
ttyS1 at MMIO 0x0 (irq = 5) is a ST16650
io scheduler noop registered
io scheduler anticipatory registered
io scheduler deadline registered
io scheduler cfq registered
loop: loaded (max 8 devices)
mice: PS/2 mouse device common for all mice
Freeing unused kernel memory: 528k freed
Laun serial8250: too much work for irq4
Looking At the Source Code for the Driver
It was quite easy to locate the source code, thanks to the error message displayed on the console. From the Linux sources, drivers/serial/8250.c:
static irqreturn_t serial8250_interrupt(int irq, void *dev_id, struct pt_regs *regs)
{
        struct irq_info *i = dev_id;
        struct list_head *l, *end = NULL;
        int pass_counter = 0, handled = 0;

        DEBUG_INTR("serial8250_interrupt(%d)...", irq);

        spin_lock(&i->lock);

        l = i->head;
        do {
                struct uart_8250_port *up;
                unsigned int iir;

                up = list_entry(l, struct uart_8250_port, list);

#ifdef CONFIG_TSI108_BRIDGE /* for TSI108_REV_Z1 errata U2 */
                /* read IIR as part of 32-bit word */
                iir = (in_be32((u32 *)(up->port.membase + UART_RX)) >> 8) & 0xff;
#else
                iir = serial_in(up, UART_IIR);
#endif
                if (!(iir & UART_IIR_NO_INT)) {
                        spin_lock(&up->port.lock);
                        serial8250_handle_port(up, regs);
                        spin_unlock(&up->port.lock);

                        handled = 1;

                        end = NULL;
                } else if (end == NULL)
                        end = l;

                l = l->next;
                if (l == i->head && pass_counter++ > PASS_LIMIT) {
                        /* If we hit this, we're dead. */
                        printk(KERN_ERR "serial8250: too much work for "
                                "irq%d\n", irq);
                        break;
                }
        } while (l != end);
What the code seems to indicate is that the driver is in a loop waiting for an interrupt to happen to handle it, as more characters need to be sent. If the interrupt from the device doesn't occur in a timely fashion, the driver exits the loop and outputs the error message we saw on the console. Of particular interest seems to be the IIR register (Interrupt Identification Register), part of the UART protocol.
Extracting Waveforms of the UART
The next step is to switch to hardware debug mode on ZeBu and extract waveforms of the UART controller around the timeframe that the driver is reporting the problem.
Hardware Triggers
The first difficulty is to get a reasonable approximation of when, in terms of hardware cycles, the problem occurs. Indeed, the Linux boot itself lasts about 1 billion cycles and it's simply not reasonable to trace the DUT for that entire period. To reach the interesting section quickly, we will use a hardware trigger, which is one of the capabilities of the ZeBu run-time hardware environment. The emulator can stop at any cycle where the PC of the processor is equal to a certain value. Unlike software breakpoints (using a software debugger such as gdb), hardware triggers stop both the processor core and the rest of the SOC. This is especially important when debugging interrupt and asynchronous events between the core and the rest of the SOC. Hardware triggers behave like a Verilog simulator: time is suspended and waiting has no side-effect on the behavior of the DUT. When emulation resumes, the SOC and its test environment continue as if nothing had happened.
Software Debugging: Using System.map
To make things simpler, we take advantage of the System.map file generated when compiling the Linux kernel (or any C program for that matter) to obtain the mapping between the driver function name (serial8250_interrupt) and its hardware address:
$ grep serial8250_interrupt System.map
d008769c t serial8250_interrupt
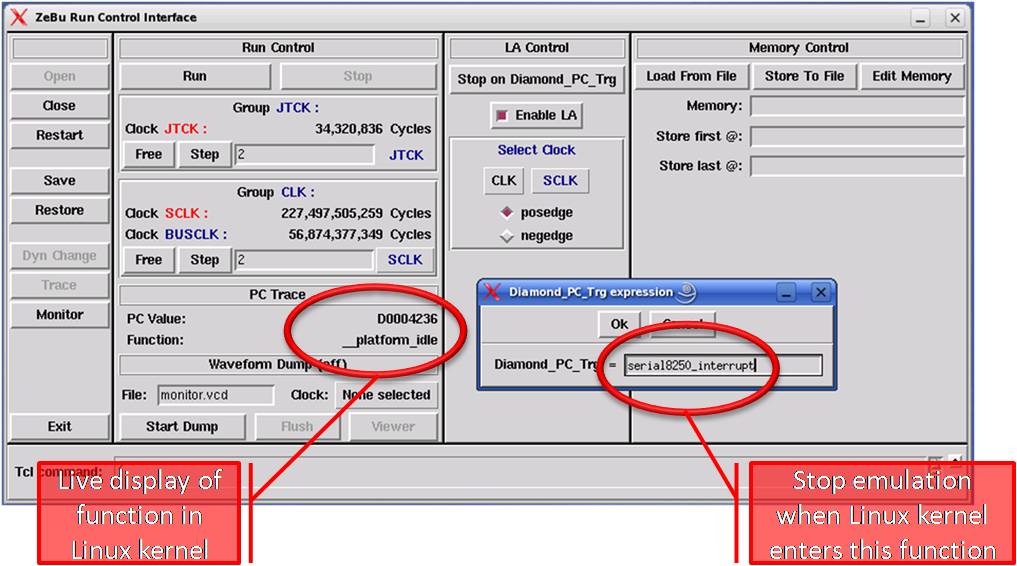
We could then set a trigger to stop ZeBu when the PC of the Diamond processor reaches that address. To make things even easier, we added a few lines of TCL to the ZeBu run-time GUI (zRun) so that we can type directly the function name and the GUI will automatically search System.map to find out the actual hardware address: Once the file System.map is parsed into the associative array czrAddFromSym, we just add two lines (in bold) to the existing zRun TCL code, in the section that processes the trigger input by the user:
proc getDynamicTrigger { } {
  global logFile
  global selectedTrig ret prog
  set prog [ZEBU_Trigger_getExpr $selectedTrig]
  set ret  1

  set okCmd     { global ret
                  global prog logFile
                  # use system.map
                  set simprog "Diamond_PC\[31:0\]==$czrAddFromSym($prog)"
                  set ret [ZEBU_Trigger_setExpr $selectedTrig "$simprog"]
                  destroy .la.progDynaTrig
                }
We also added a field in the zRun GUI window so that the current function name of the Linux kernel is displayed continuously. Just watching the name change with the kernel activity is very revealing. It provides an immediate and visual feedback on where the CPU is spending cycles. More fancy applications could be implemented, such as non-intrusive code profiling, especially for critical sections of interrupt vectors that are hard to instrument otherwise.

Obtaining Waveforms
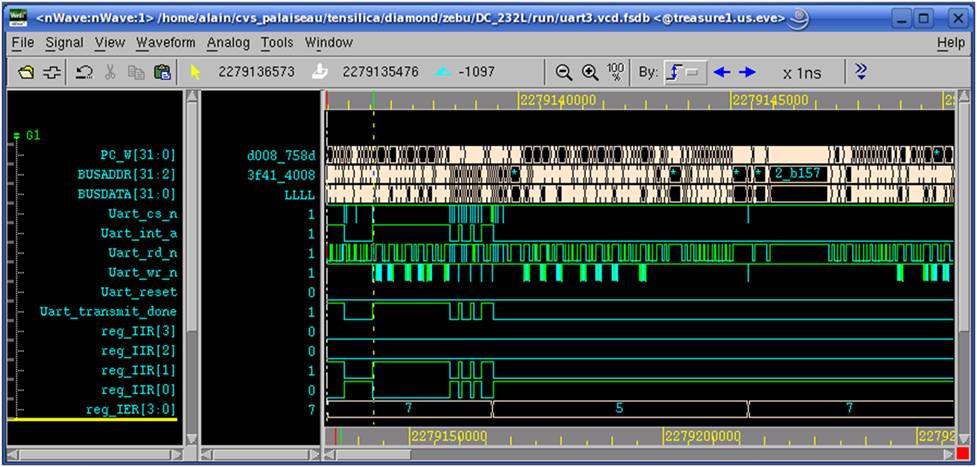
Once ZeBu stops around the area of interest, we activate dynamic probes, which allow us to trace any signal we want inside the DUT to a standard waveform format. In our case, we trace all the signals in the UART controller and especially the IIR register and the interrupt line.
By looking at the waveforms, we see that the first few characters are indeed sent correctly on the data bus. But then, no more interrupt is raised by the controller (signal Uart_int_a), so no more characters are sent, which would explain the error message we receive from the driver.
Fixing the Bug
With the previous information, we start to double-check the specifications of the UART and come across an ambiguity. The UART is supposed to send an interrupt whenever its buffer is empty. However, it is not clear whether an interrupt should be asserted when the buffer is empty and the UART is then programmed in interrupt mode. In effect, it all becomes a matter of interpretation of the English specification between "raise an interrupt when the buffer is empty" and "when the buffer becomes empty". Based on the expected behavior of the software driver and the waveforms, we changed the behavior of the UART to generate the interrupt every time the buffer is empty.
Results
After fixing the UART logic, this appeared on the console:
ZeBu-Diamond Console
Linux version 2.6.10_mvl401-xt2000-xtensa_linux_le (alain@treasure5.us.eve) (gcc version 3.4.3 (MontaVista 3.4.3-25.0.135.0702842 2007-03-23)) #76 Tue May 1 11:02:33 PDT 2007
On node 0 totalpages: 8192
  DMA zone: 8192 pages, LIFO batch:2
  Normal zone: 0 pages, LIFO batch:1
  HighMem zone: 0 pages, LIFO batch:1
Built 1 zonelists
Kernel command line: console=ttyS0 mem=64M debug init=/sbin/init root=/dummy
PID hash table entries: 256 (order: 8, 4096 bytes)
Console: colour dummy device 80x25
Dentry cache hash table entries: 8192 (order: 3, 32768 bytes)
Inode-cache hash table entries: 4096 (order: 2, 16384 bytes)
Memory: 30936k/32768k available (606k kernel code, 1784k reserved, 80k data, 528k init 0k highmem)
Calibrating delay loop... 15.76 BogoMIPS (lpj=78848)
Mount-cache hash table entries: 512 (order: 0, 4096 bytes)
spawn_desched_task(00000000)
desched cpu_callback 3/00000000
ksoftirqd started up.
desched cpu_callback 2/00000000
desched thread 0 started up.
Linux NoNET1.0 for Linux 2.6
Initializing Cryptographic API
Serial: 8250/16550 driver $Revision: 1.90 $ 6 ports, IRQ sharing disabled
Registering platform device 'serial8250'. Parent at platform
ttyS0 at MMIO 0x0 (irq = 4) is a ST16650
ttyS1 at MMIO 0x0 (irq = 5) is a ST16650
io scheduler noop registered
io scheduler anticipatory registered
io scheduler deadline registered
io scheduler cfq registered
loop: loaded (max 8 devices)
mice: PS/2 mouse device common for all mice
Freeing unused kernel memory: 528k freed
init started:  BusyBox v1.4.2 (2007-04-26 04:18:24 PDT) multi-call binary
Starting pid 15, console /dev/console: '/bin/hostname'
Starting pid 16, console /dev/console: '/bin/login'
zebudemo login: demo


BusyBox v1.4.2 (2007-04-26 04:18:24 PDT) Built-in shell (ash)
Enter 'help' for a list of built-in commands.

$ pwd
/home/demo
$
Linux booted all the way to the shell. The kernel itself loads in less than 2 seconds on a ZeBu-UF 0.5. It then takes about ten seconds for the kernel to uncompress the disk image and run the init process, which in turn starts the login process and the shells. We can then proceed to bring-up the other peripherals (TFT display, Ethernet controller, etc).
Conclusion
Why was the Linux boot able to go that far, and then hang close to the end, if the UART didn't work properly? It turns out that Linux uses two different UART drivers, one (called serial8250_early) which prints characters during the early part of the boot without using interrupts, considered safer. The second one is the "real" UART driver but is only activated once the kernel has finished initialization. If we had stopped hardware testing before completing the Linux boot, relying only on the early driver version, we would not have found that problem in time. While it would have been possible to implement a workaround in the software driver after tape-out, it would have seriously impacted the processor load, as we would have had to rely on active polling instead of interrupts.
This goes to prove that the best way to know for sure that an SOC will function as expected with its target application is to actually run the application itself ahead of tape-out. By providing integrated hardware and software debugging capabilities as well as off-the-shelf transactors for most common interfaces and peripherals, ZeBu makes prototyping easy.
